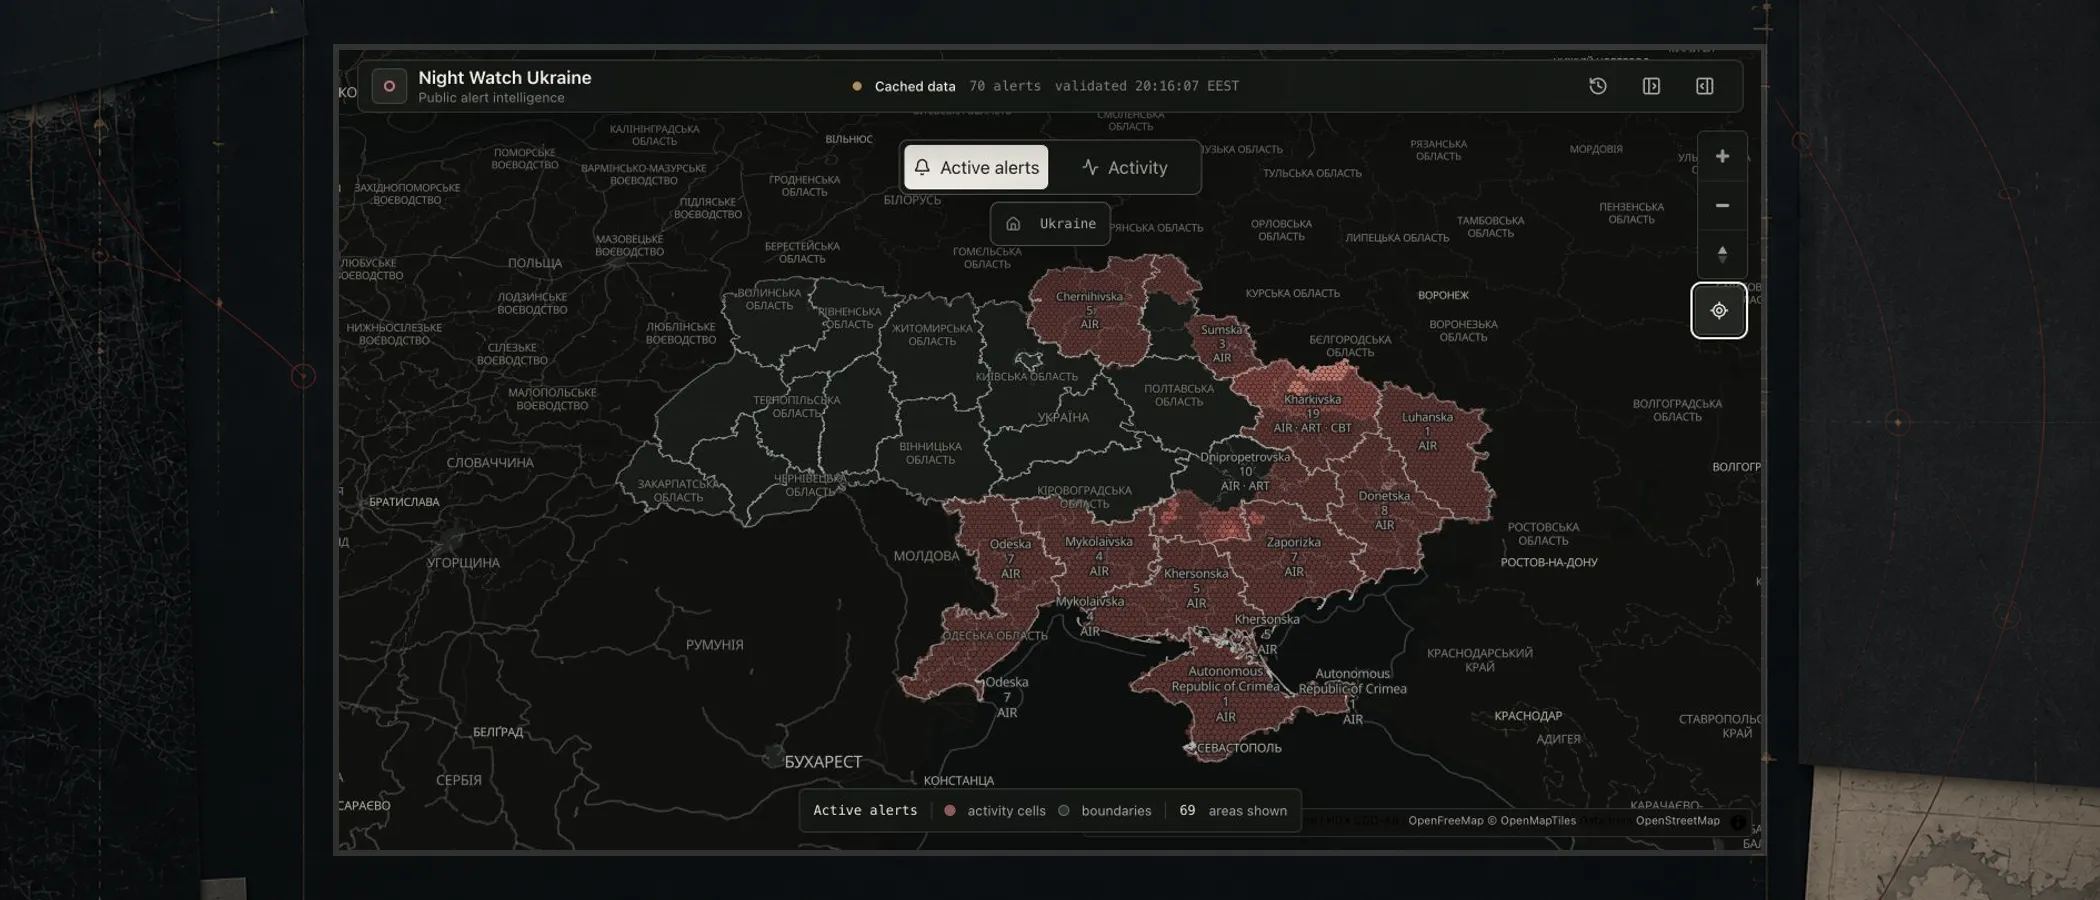
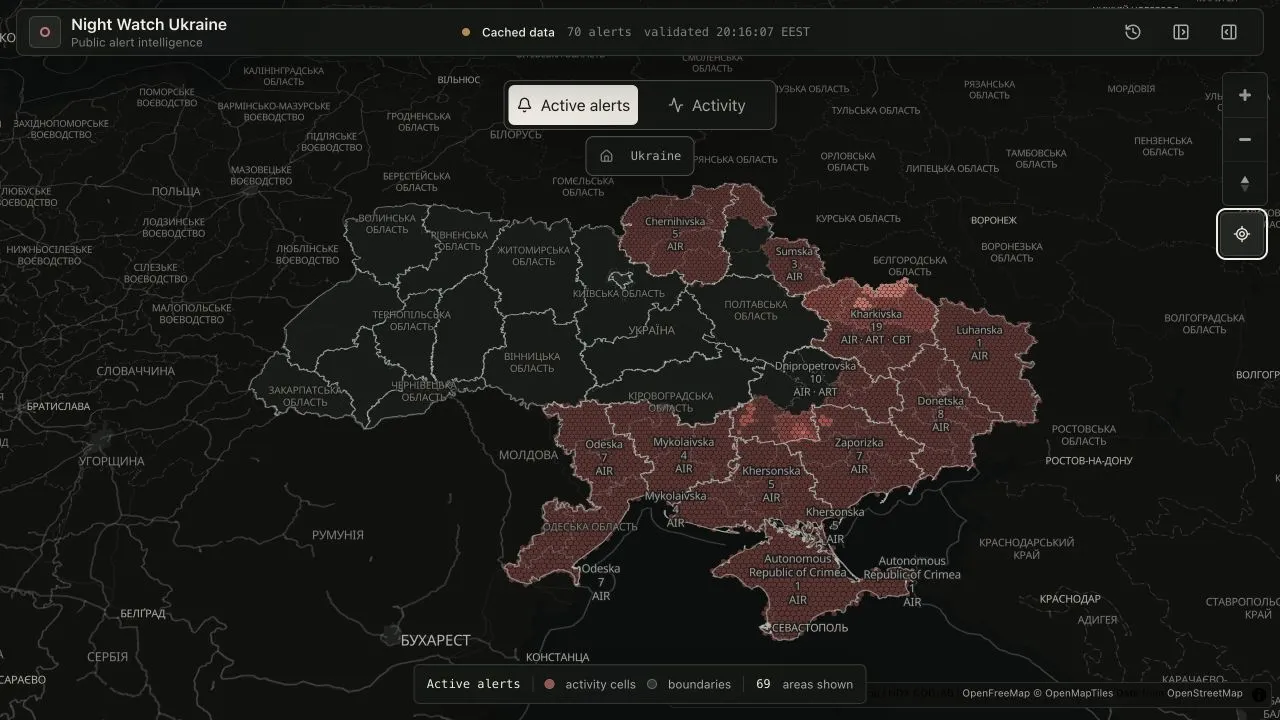
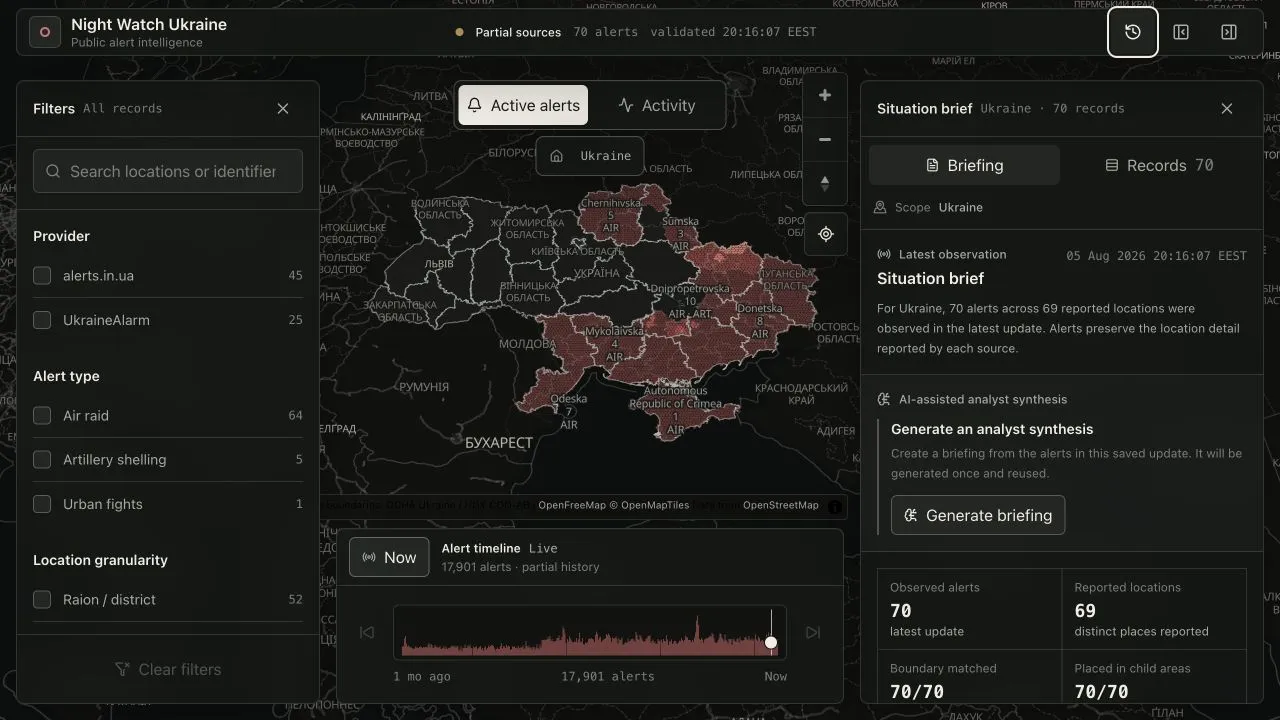
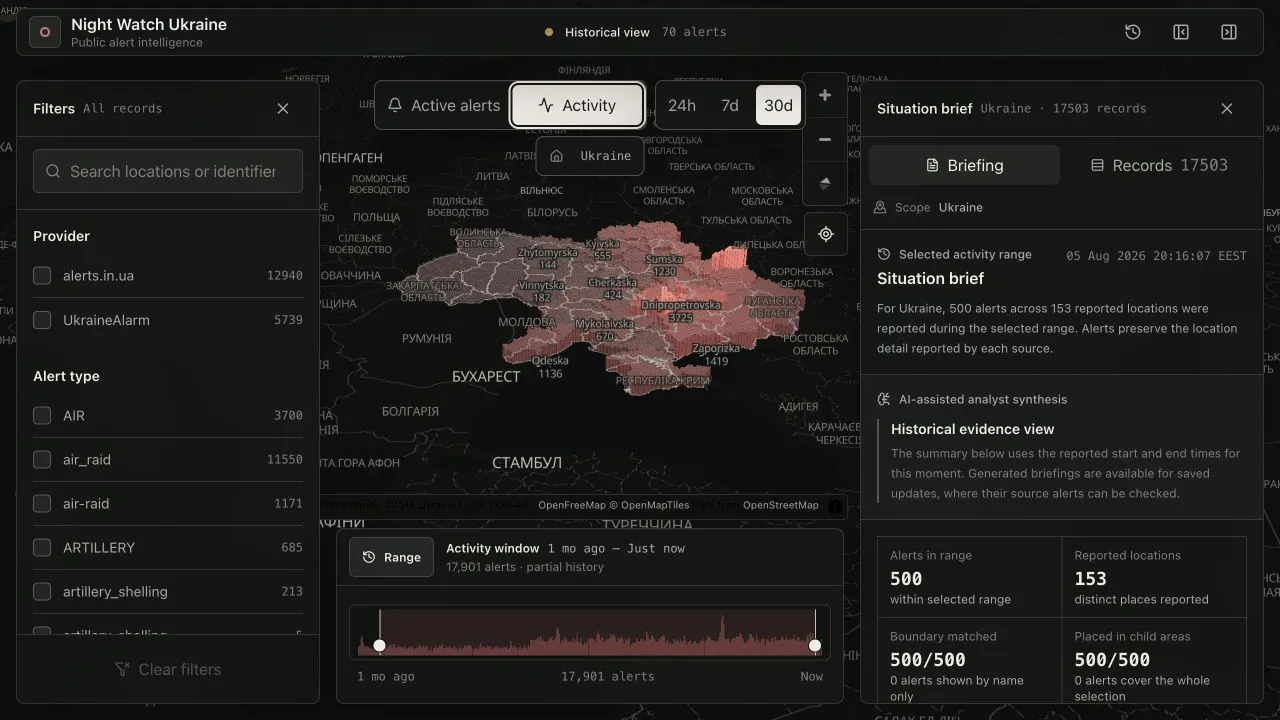
Night Watch Ukraine is an OSINT tool that combines public alert data from multiple providers and visualizes it on an interactive map. It supports live alerts, historical replay, and activity analysis in both 2D and 3D using MapLibre and deck.gl.
The source data varies heavily in structure and precision. One provider may report an entire oblast while another reports a raion, hromada, or settlement inside it. The ingestion pipeline normalizes these records while preserving their original payloads, timestamps, locations, and sources. A stable content fingerprint is derived for each observation so repeated records can be identified and deduplicated reliably.
Building a useful heatmap from overlapping regions required a separate spatial model. Each region is converted into grid samples. Samples at shared coordinates are merged, and their alert counts and active durations are accumulated before the final intensity is normalized. More precise child regions replace broader parent regions in the same area to avoid double-counting.
The visualizations support both administrative regions and a hexagonal grid in 2D and 3D. The hex-grid resolution changes dynamically based on the size of the focused region. This keeps national views readable while providing more detail when drilling into smaller areas.
Cloudflare Workers introduced strict memory constraints as the archive grew. Raw observations are stored losslessly in R2, while a Durable Object serializes ingestion so scheduled updates cannot overlap. SQLite handles deduplication and interval generation, and compact derived artifacts are built separately for the interactive parts of the application.
The historical timeline was another major technical challenge. The first version sent thousands of complete records to the browser and repeatedly filtered them as the selected time changed. Its 5,000-record limit eventually covered only around seven days.
The current version merges repeated observations into continuous alert intervals and generates one compact 31-day columnar artifact using shared string dictionaries and parallel numeric columns. The browser builds a small interval index once, allowing playback, scrubbing, and range selection without contacting a Worker during interaction. Updates are limited to one per animation frame, and full source details are fetched only when an alert is opened.
This keeps the original evidence available for inspection while giving each visualization only the processed data it needs.